Accessing data in QGIS
A few years ago now, I wrote a post covering adding vector layers to QGIS. Much time, development, and improvement has passed since then. Since the usefulness of QGIS increases proportionally with your ability to actually add data to it, it is time to revisit this topic.
QGIS has a toolbar strictly for adding data. It is organized with buttons for each different data source. This seems like a logical way to approach talking about it as well. I will include a brief description of each data source, then the steps for adding said data to your project. I will discuss the following options for adding data to QGIS:
- Add Vector Layer
- Add Raster Layer
- Database Formats
- Web Formats
- Add Delimited Text Layer
- Add/Edit Virtual Layer
- New GeoPackage Layer
Add Vector Layer
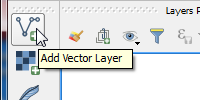
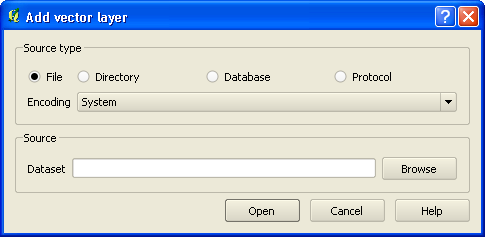
This dialog used to be the primary way of adding data other than raster, to QGIS. It had, and still has, the functions to add data from a variety of file-based, directory style, and full fledged SQL databases. I think in time, they realized that there were too many different ways of connecting to data, and having them all in one dialog, made it really complicated and confusing. To remedy this, they split out the different data sources to their own icons, and downplayed that functionality in the Add vector layer dialog. What you have left with now, is really a dialog for adding file-based vector layers, instead of more broadly vector layers.
Here are the top 3 file based sources you will be most likely to add:
Shapefile
The shapefile is probably the most widely used format to transfer data. It is a proprietary format created by ESRI for their ArcView product, but has become the defacto standard for sharing data. At this point, it is straight-forward and simple to use. I think its popularity may be on the wane due to other more compact formats being developed, some of which I’ll discuss below, and also the increased availability of layers available as web services.
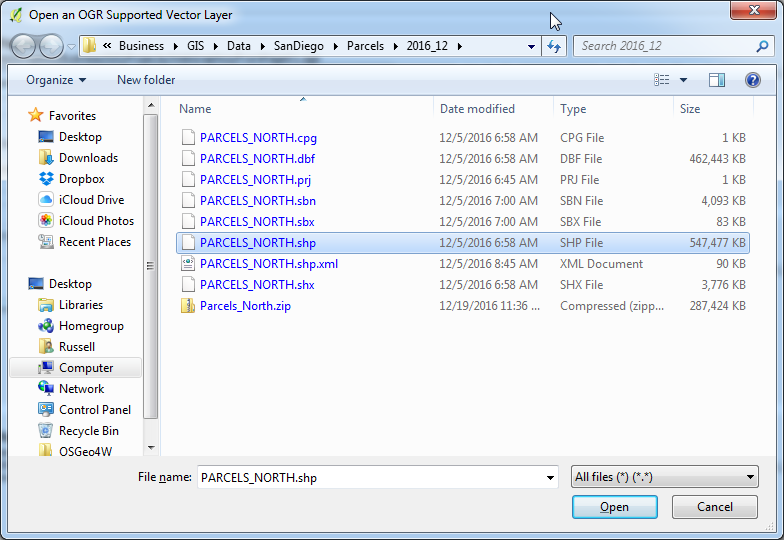
- Choose Source Type
File. Browse to your desired .shp, and Click Open.
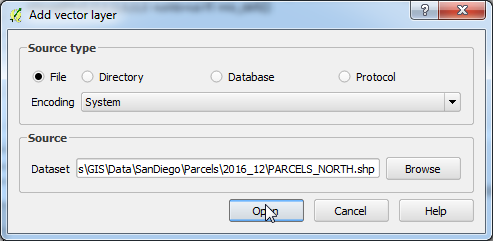
- This will fill in your source dataset. Click
Opento load layer into your map.
File Geodatabase
The File Geodatabase is Esri’s proprietary, single-user database format. It is file-based, but not a single file. A File GDB is made up of a directory of different files. The directory name is the File GDB name and will end with the .gdb extension. The component files are all encoded, so there is not much use to poking around in them. The format is accessed using the File GDB API from Esri. It allows read, write and basic layer create, though no rasters are supported. An Open File GDB driver has also been developed for read-only access. This process is assuming use of the Esri API.
- Change the
Source Typeto "Directory". UnderSourcechoose Type = ESRI FileGDB. Then Browse to choose your dataset.
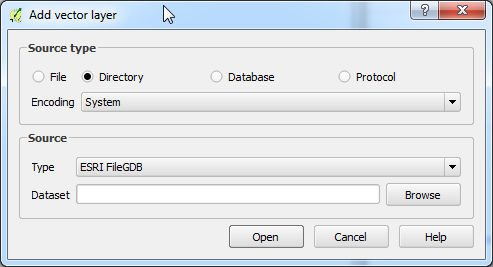
- Select the
.gdbdirectory itself, not any of the files contained within. Click Select Folder
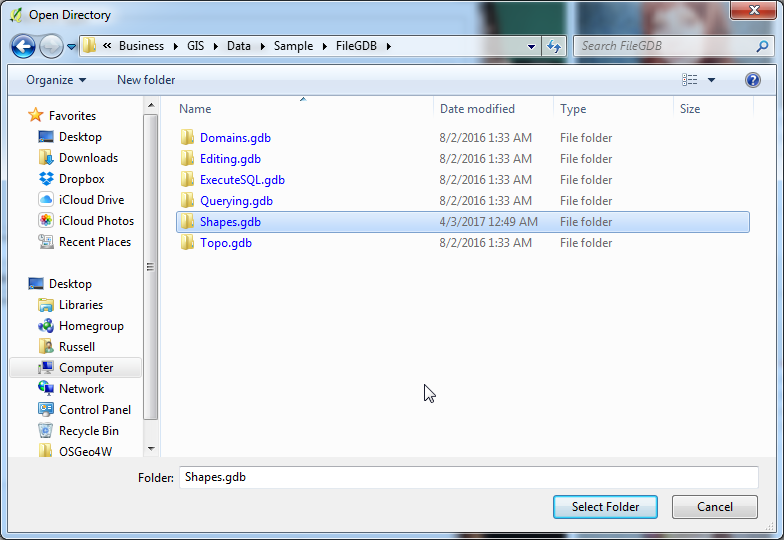
- This will fill in your
Source DatasetClick Open to bring up the list of layers in the File GDB.
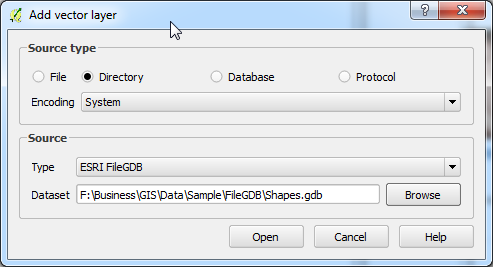
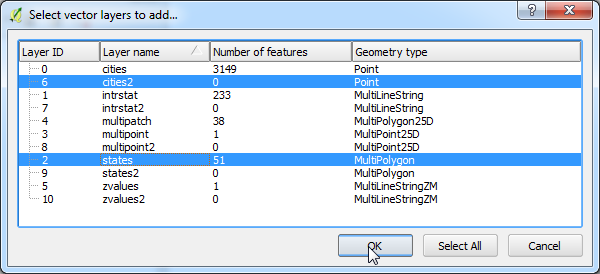
- Select the layers you would like to load in the map. Hold
CTRLto select multiple layers. Click OK.
Geopackage
As I mentioned above with the shapefile, there are new spatial data formats being developed, and gaining a following. The GeoPackage is one of the newest. It was developed by the Open Geospatial Consortium, with the first draft published in August 2015. The specification utilizes an SQLite database as the storage medium, and incorporates spatial standards. It is usable across all platforms and operating systems. You can recognize these files by the .gpkg extension.
- Leave
Source typeas "File". Browse to select the GeoPackage you wish to open. You may want to change theFile Typeto GeoPackage to narrow the list of files being displayed. Click Open
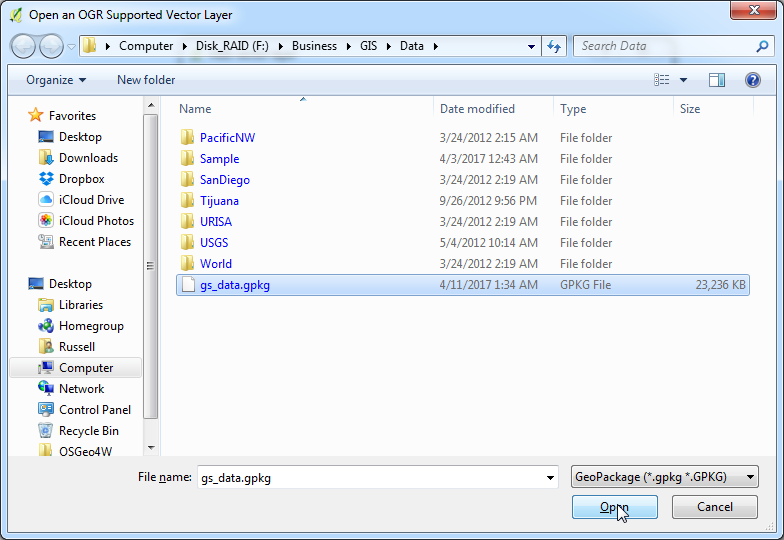
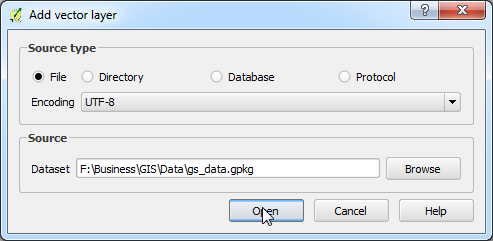
- This will fill in your
Source Dataset. Click Open to bring up the list of layers in the GeoPackage.
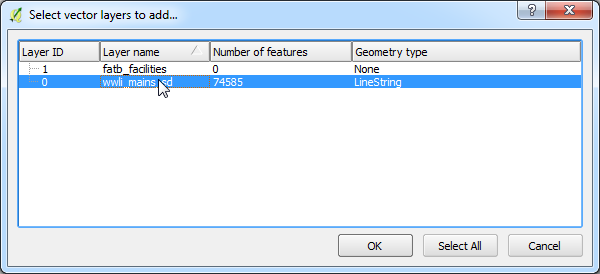
- Select the layers you would like to load in the map. Hold
CTRLto select multiple layers. Click OK.
Add Raster Layer
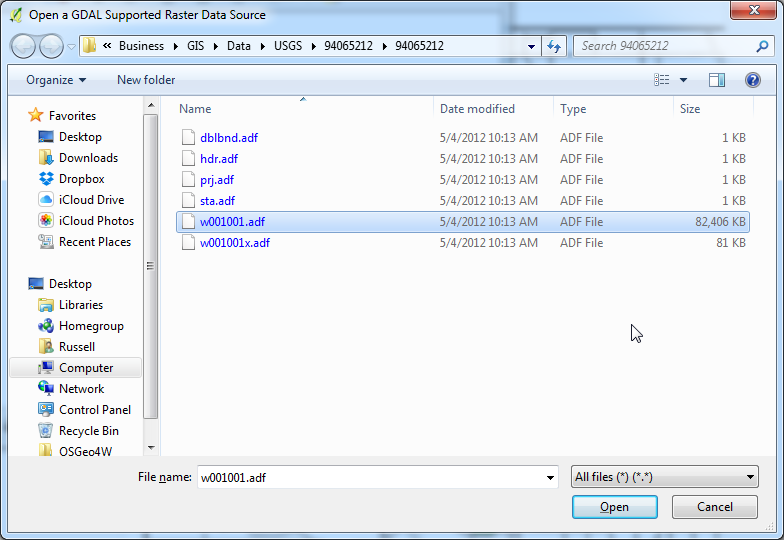
Select any raster layer that is supported by QGIS. This includes any that are supported by the GDAL driver, as well as raster tiles in a GeoPackage, and other specialty formats. You will need to ensure that your raster has a spatial reference defined, or be able to specify one upon loading.
- Select desired raster layer. Use
File Type, if desired, to limit displayed files to those of a particular format. Click Open.
Database Formats
Add SpatiaLite Layer
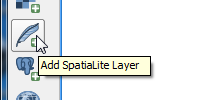
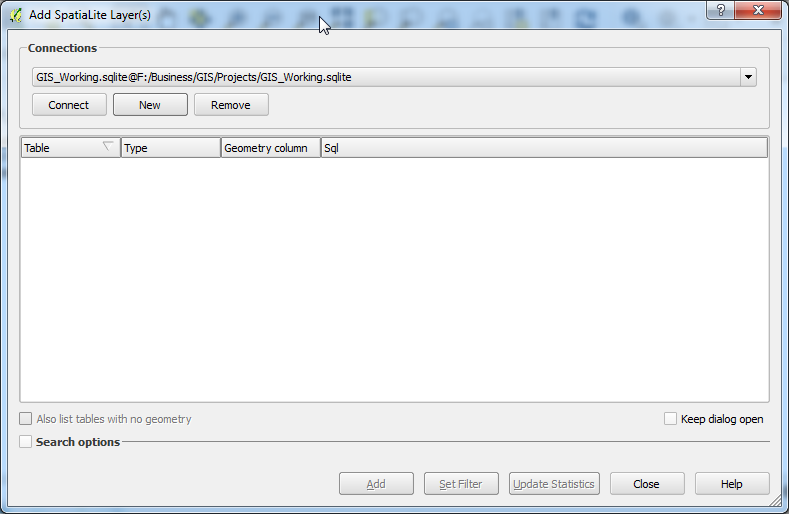
SpatiaLite is an SQLite database with a spatial SQL added in the form of an open-source library. Like the MS Access database, the entire database is contained in a single file. The benefit this has over MS Access is that it is open source, and mostly SQL standards compliant. Like most SQL databases, you must create a connection to a database as the first step to accessing the data within. This process is assuming you have never connected to a Spatialite DB before.
- Click New Connection.
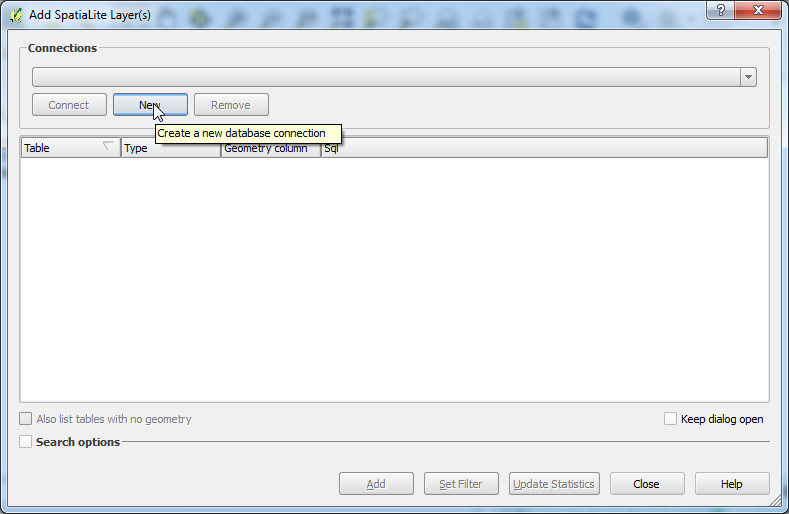
- Browse to the database that you want to access, and Click Open.
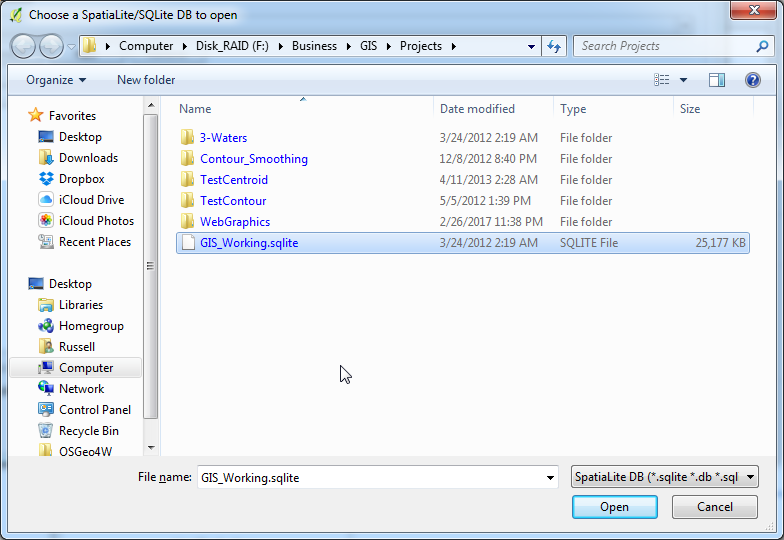
- That database will show up in the Connections window. If you have connected to others in the past, they will also show up in the pull-down. Select the desired database, and Click Connect.
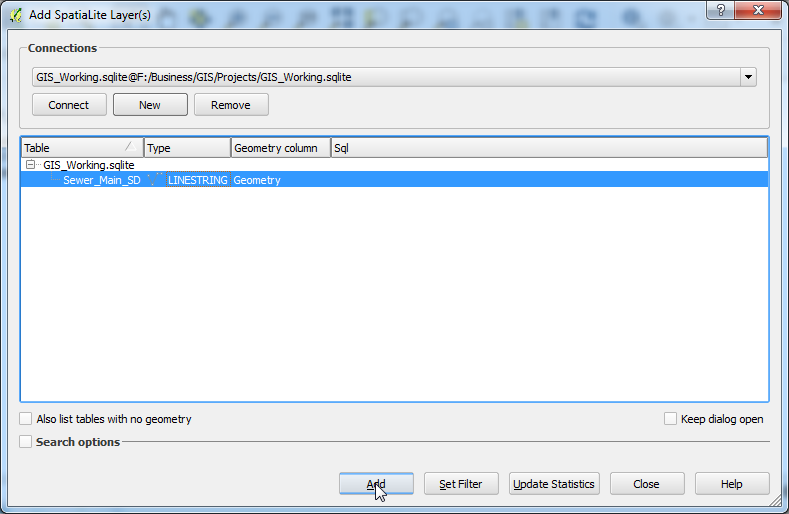
- This will list all the tables, spatial or not, contained in the database. Select the ones you wish to load in. Hold
CTRLto select multiple layers. Click Add.
Add PostGIS Layer
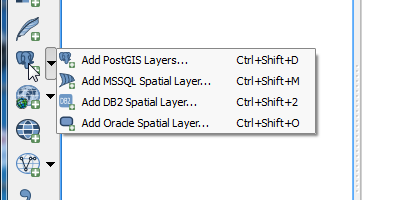
PostGIS is a spatial extension for the PostgreSQL database. This database is hosted on a server like Microsoft SQL Server or Oracle. The PostGIS extension provides full spatil functionality with both raster and vector data types. This database is used as the backend for many enterprise GIS systems, as well as many other web applications. Like with Spatialite you have to create a connection to these databases, but you are actually connecting to a particular server and specific database name, instead of choosing a file.
- Click on New to set up a new connection.
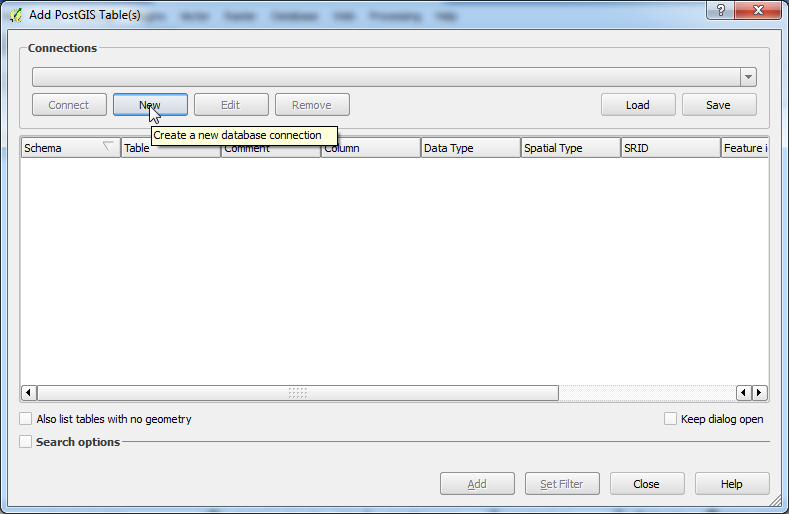
- Enter connection information.
- Enter a
Namefor the connection - The
Host Nameis the computer the database is located on - 5432 is the standard
Port. Change if you modified this at the time of installation. - Enter
Database Name. - Enter
UsernameandPasswordfor the database. Check Save to store these for later. The password is stored as plain text, so I only store the username. This will require you to enter the password each time you open a QGIS project that references tables from this database. - Check box to
Also list tables with no geometry. This will ensure that all available tables are listed. - Click
Ok
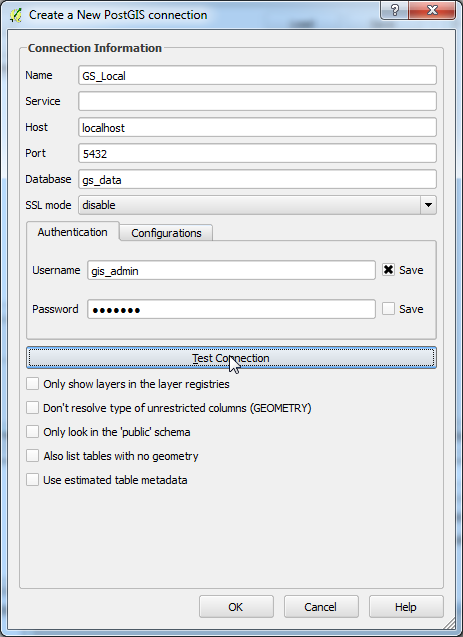
- Enter a
- Select the desired connection from the pull-down list. Click Connect.
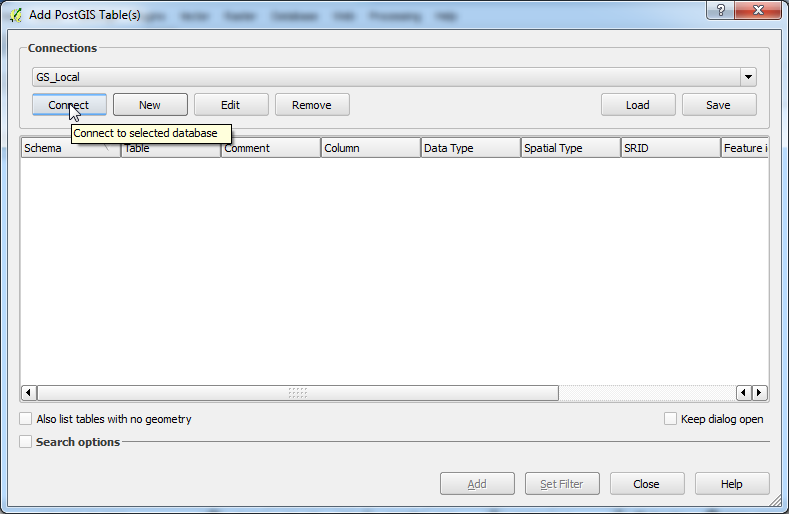
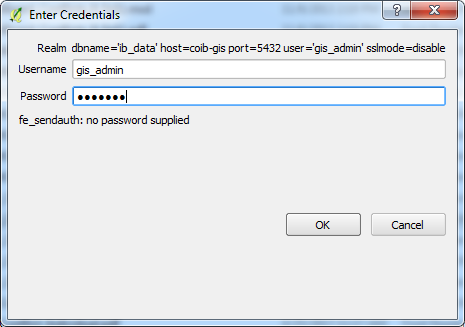
- If you are creating a new connection, you will be logged in as part of that process. If you are using an existing connection at a later date, and did not save the
Usernameand/orPassword, you will need to reenter your credentials.
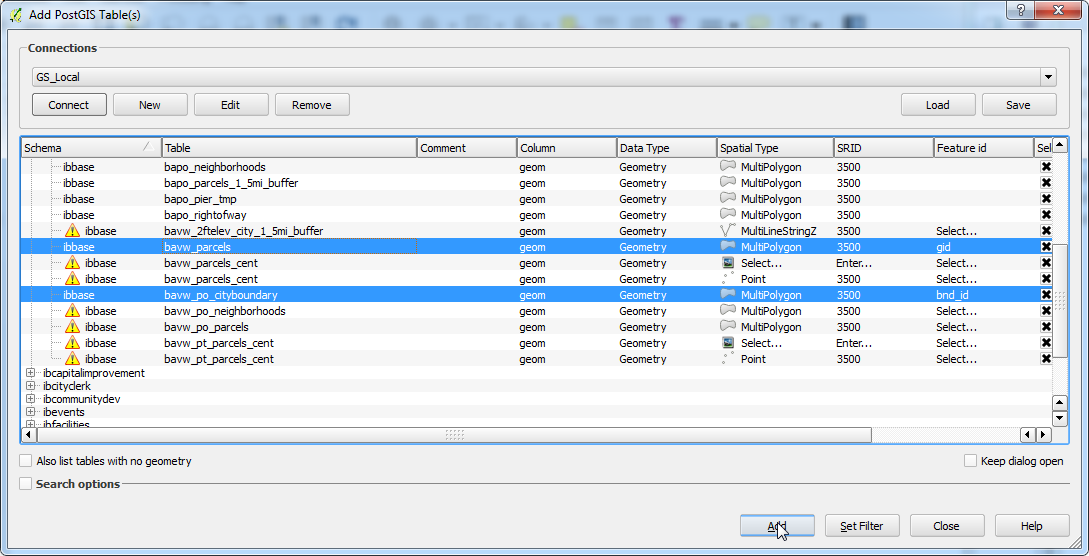
- Once you are logged in, the list of available tables will come up. On the right of the image, is a column for
Feature ID. This is a requiredUnique IDfield for display in QGIS. Any table with aPrimary Keyalready defined will have the Feature ID auto selected. If you have created aView, you will need to select the Feature ID field prior to it being possible to select for addition to QGIS. Often, when you click the pulldown to select the correct field, QGIS will make a guess and fill in the pulldown with a name. When they get it right, don’t be fooled, as your work is not done. As you can see in the image, checking the box by your desired column name is what actually marks it. Once you do that, and click on the database name to the left, the Exclamation mark will go away and you’ll be able to select the table. This can be frustrating if you are using a lot of views in your maps.
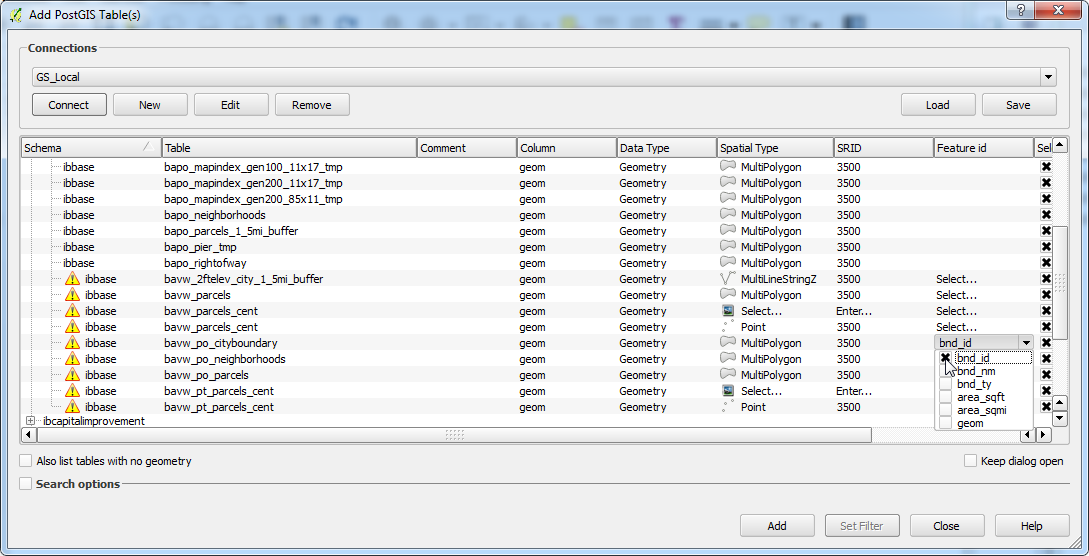
- Once you have done the above, you will be left with the list of valid tables, both spatial and non, contained in the database. Select the ones you wish to load in. Clicking once will select or deselect as desired. No need to hold
CTRL. Click Add.
Web Formats
The following are all formats for adding data from the web. These might be shared from a government agency, or data stored in a different database that you don’t have a direct connection to. These layers are similar to databases in that you create a connection to them that is then reusable.
Add WMS/WMTS, or ArcGIS MapServer Layer

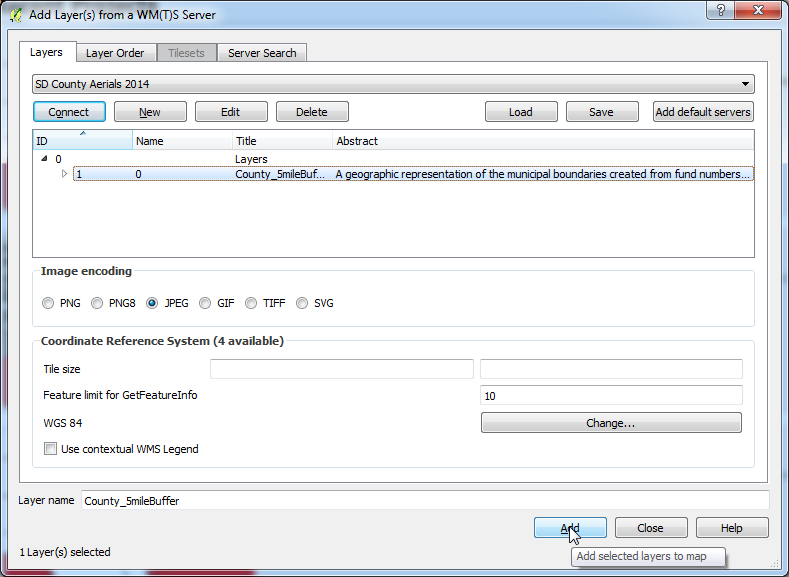
A Web Map Service (WMS) is the OGC standard for serving spatial data in a static, tiled format over the internet. Data is being provided more and more often in this format by governments and agencies as a means of providing the public access to data without having to download and maintain it. Since the data is provided in a tiled image format, there is very low overhead for the end user. Most often these layers are available without any login credentials necessary.
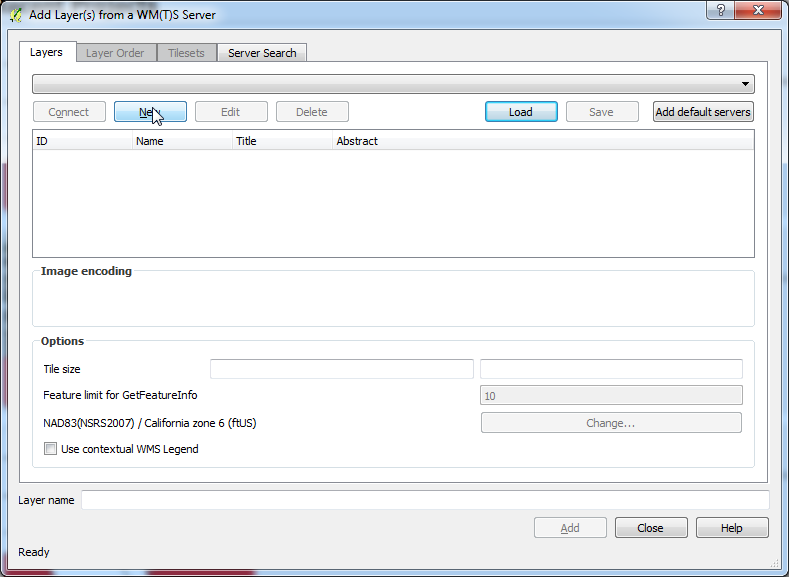
- Create a
New Connection. Click New.
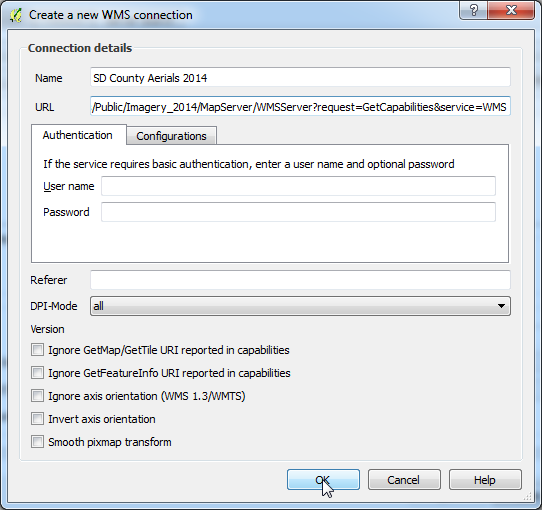
- Give your connection a name, then copy in the correct
URL. If necessary, enter theUsernameandPassword. You will have to verify with the provider whether they are needed or not. Click Ok.
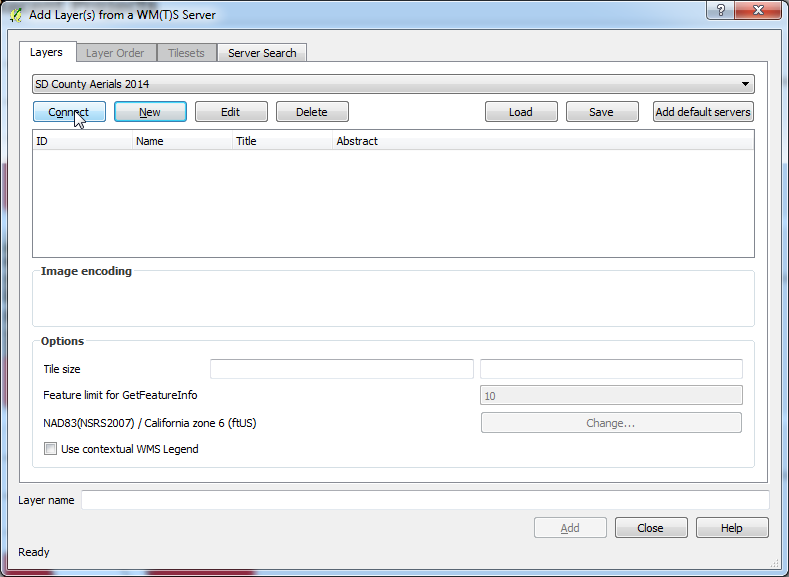
- This will add the connection to the drop down. If you have others, select your desired
Connection. Click Connect.
- This will populate the list of available
WMSlayers. Select the desired layers to add. Click Add.
Add WCS Layer
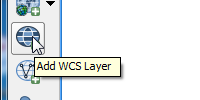
An OGC Web Coverage Service (WCS) serves spatial-temporal data in a web capable format. This is a relatively new specification, and honestly, one I’m not that familiar with. Check out the Wikipedia article for a more detailed explanation: Web Coverage Service
- Create a
New Connection. Click New.
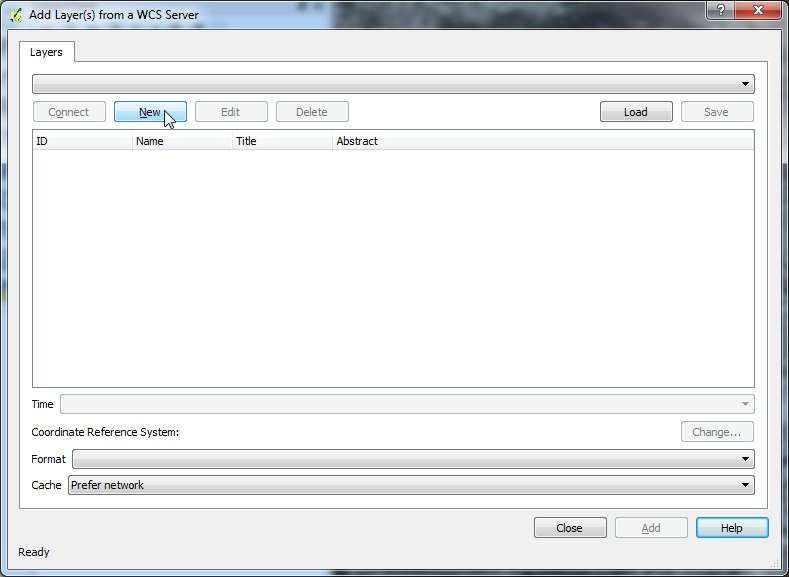
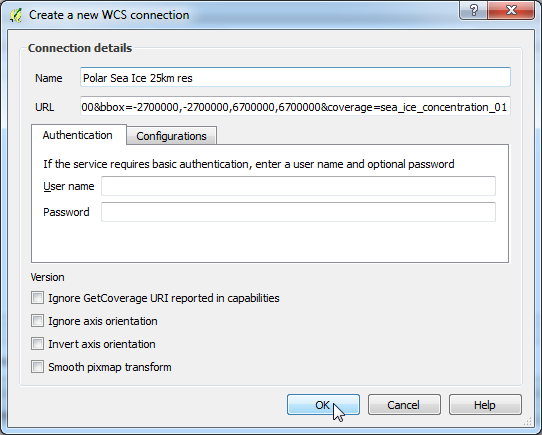
- Give your connection a name, then copy in the correct
URL. If necessary, enter theUsernameandPassword. You will have to verify with the provider whether they are needed or not. Click Ok.
- This will add the connection to the drop down. If you have others, select your desired
Connection. Click Connect.
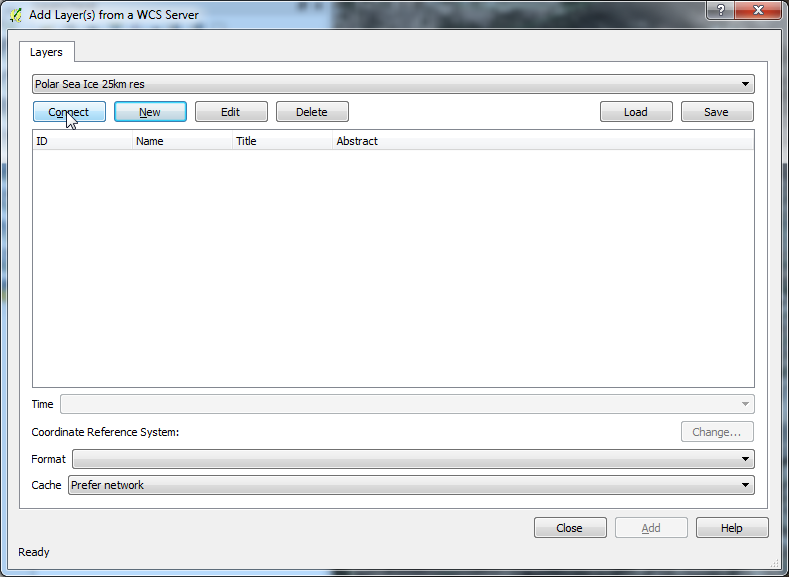
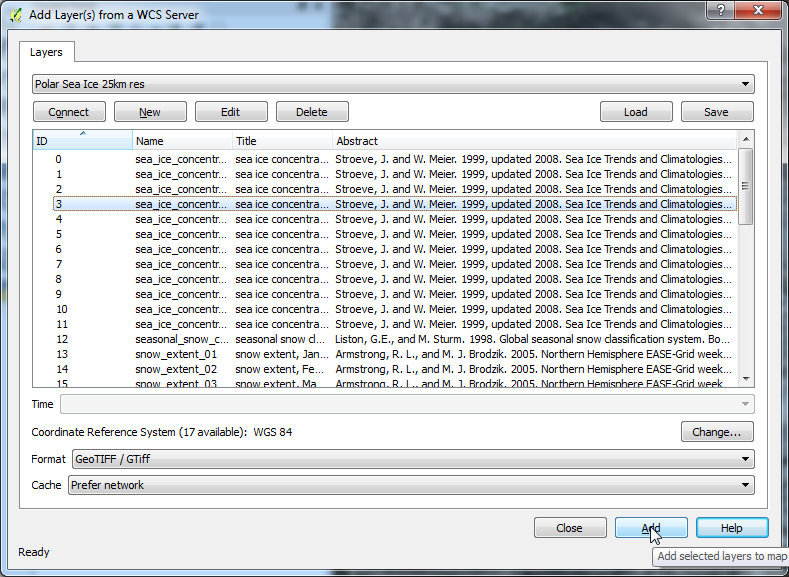
- This will populate the list of available
WCSlayers. Select the desired layers to add. Click Add.
Add WFS Layer
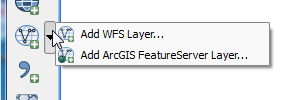
A Web Feature Service (WFS) is the OGC standard for serving feature data in a discrete means. Where the WMS layer serves data in a tiled format, and is static, the WFS layer is actively pulling data from the source. Since it is serving the actual data, it is much easier to overlay this data. As well, these layers may be set up for editing. This format is used to serve data for remote editing purposes.
- Create a
New Connection. Click New.
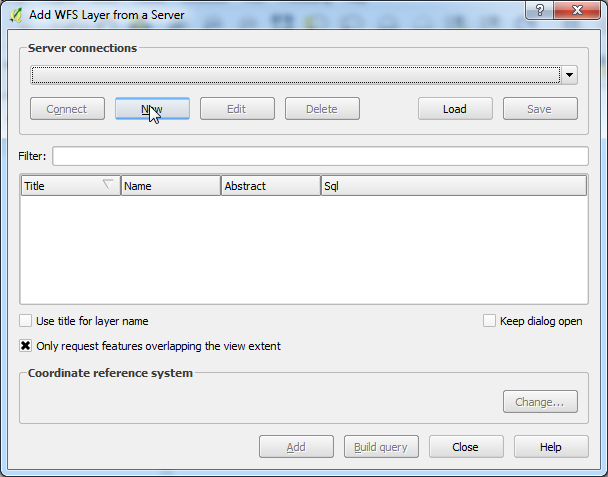
- Give your connection a name, then copy in the correct
URL. If necessary, enter theUsernameandPassword. You will have to verify with the provider whether they are needed or not. Click Ok.
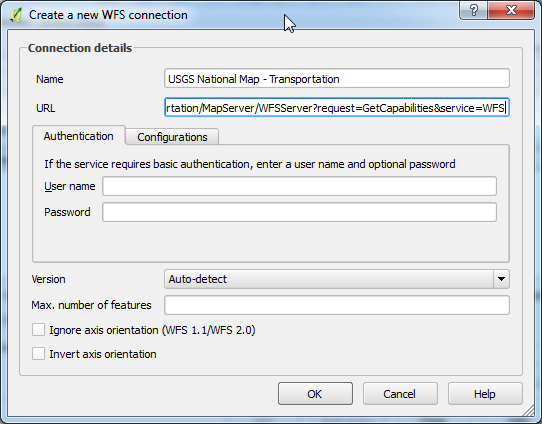
- This will add the connection to the drop down. If you have others, select your desired
Connection. Click Connect.
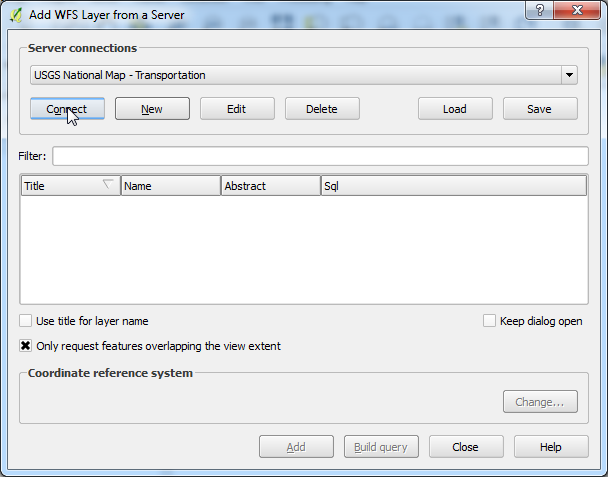
- This will populate the list of available
WFSlayers. Select the desired layers to add. Click Add.
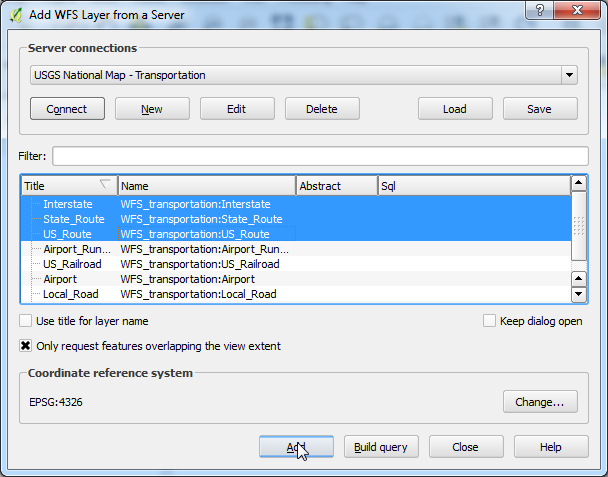
Add Delimited Text Layer
A delimited text layer is just what it means. It can be any form of text file with columns of data, spatial or non. One great thing is that if you have spatial data encoded as WKT (Well Known Text), then you may have all geometry types, not just Point data.
- Create a layer from a delimited text file. See the basic requirements below the image.
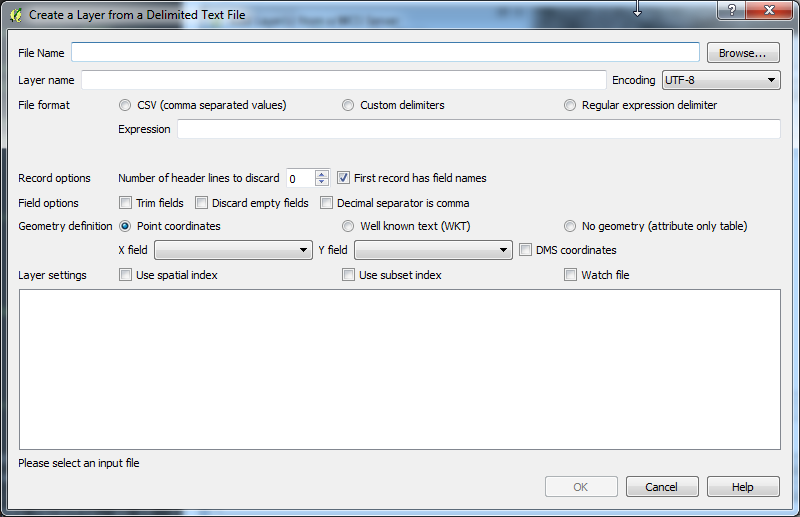
The basic requirements are:- Choose the
Textfile name. - Specify a
Layername to be used in QGIS. - Choose the
File Format. This can beCSV, aCustom Delimiter, or aRegular Expression. That last is pretty awesome as it allows you to take a non-traditional text file, and as long as you can structure the appropriate Regular Expression, turn it into columnar data table. Huge Flexibility!! - Choose
Headerrows, andColumn Names. This allows you to ignore rows at the beginning of a text file without having to manually delete them. - Choose
Geometry Type, orNo Geometry. If there is geometry, ChooseXandYfields, orWKTfield.
- Choose the
-
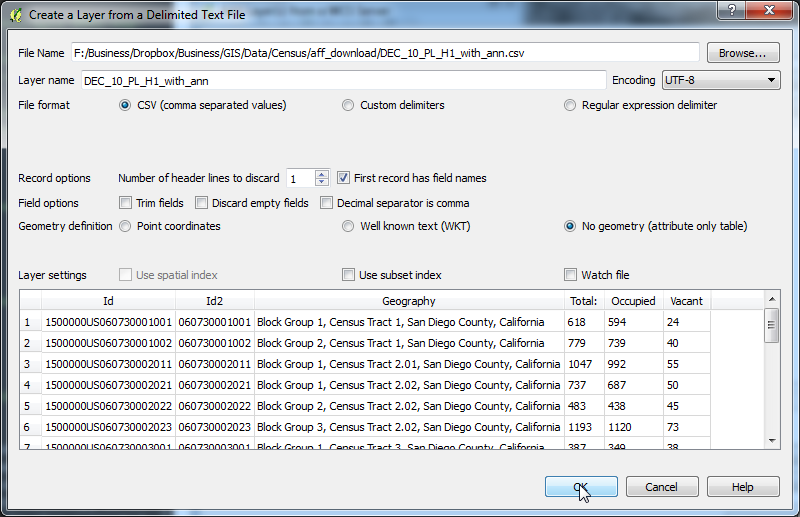
Basic delimited text settings filled out. Sample data shown in bottom of window. Click Ok.
-
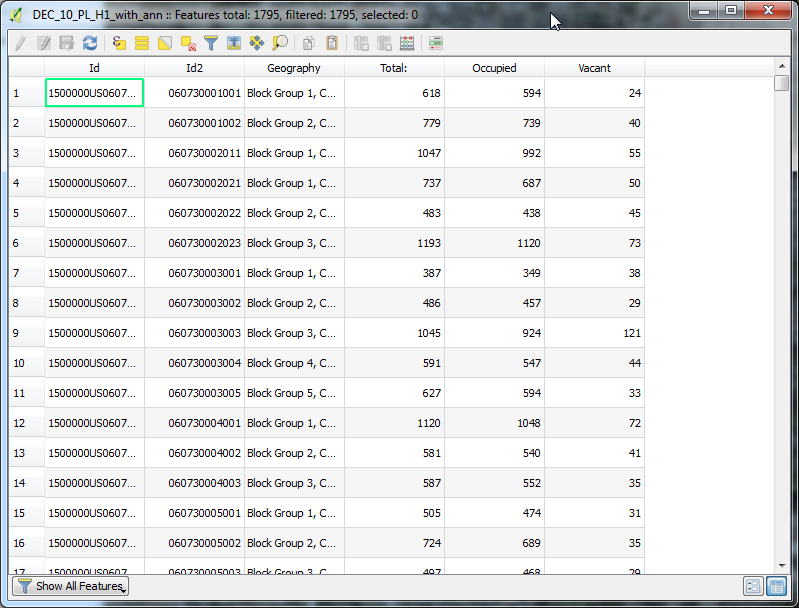
Sample data when loaded into QGIS.
Add/Edit Virtual Layer
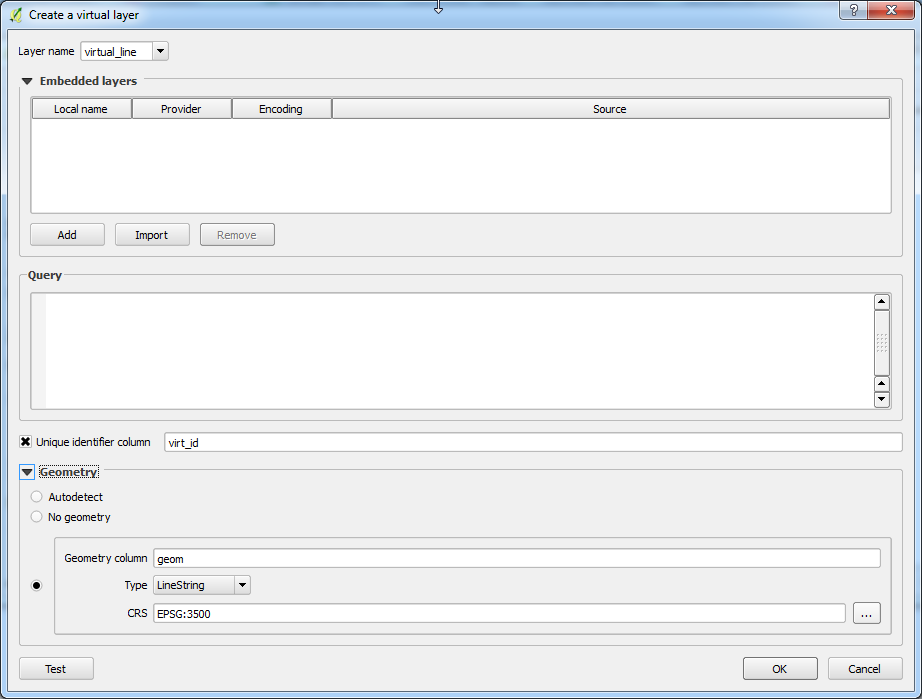
A virtual layer is contained within the QGIS project file. They can be useful for creating small graphics that would not be needed at any time other than the project you are working in. If you are coming from the ArcGIS world, this can be a replacement for part of the graphics toolbar, where you could draw points, lines, and polygons that weren’t part of the table of contents, and were always on top. The benefit to a virtual layer is that you have the flexibility to interact with them the same ways you would a spatial layer from any other source, and they are part of the map layers, so they can be reordered and are not constrained to the top of the stack.
- The basic requirements are a
Layer Name,Unique IDfield name, and if a geometry layer, theGeometry Column. Click Ok.
New GeoPackage Layer
This is not so much about loading data, but about creating a new layer in a GeoPackage.
- Create GeoPackage Layer. Basic requirements are listed below.
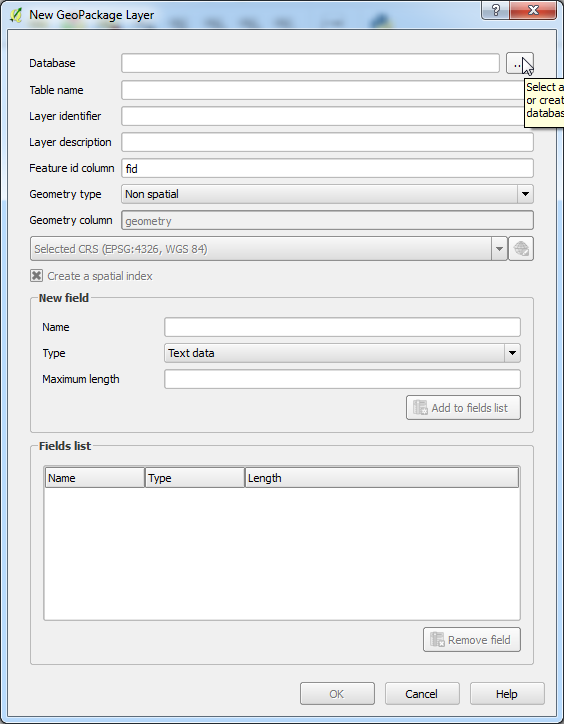
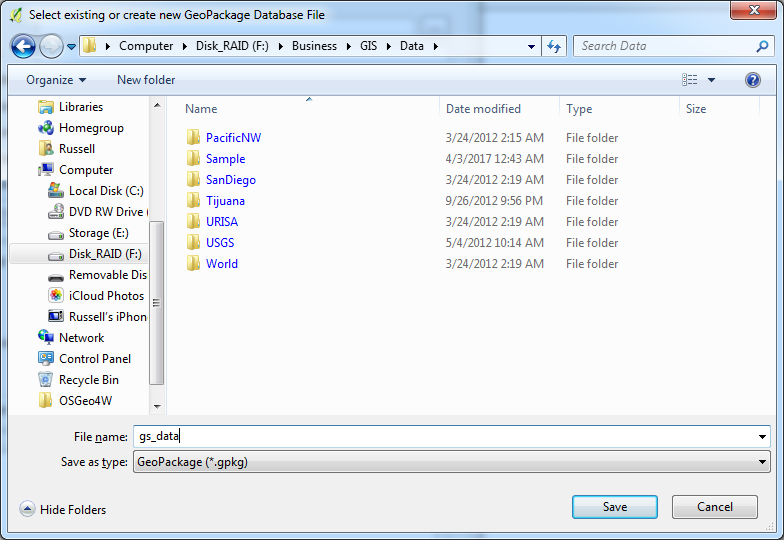
- Choose the
GeoPackagedatabase. You may pick an existing one or create a new one.
- Pick a
Table name. This will need to abide by constraints of SQLite DB format. - Choose
Layer Identifier. This may be a more readable name, as spaces are allowed. - Enter
Layer Description. - Name the
Feature IDcolumn. - Choose the
Geometrytype and if applicable,Geometry Column, andSpatial Reference. Always create aSpatial Index!
- Choose the
- Add Fields for new layer. Specify
Field Name,Field Type, andMax Length. Click Add to fields list.
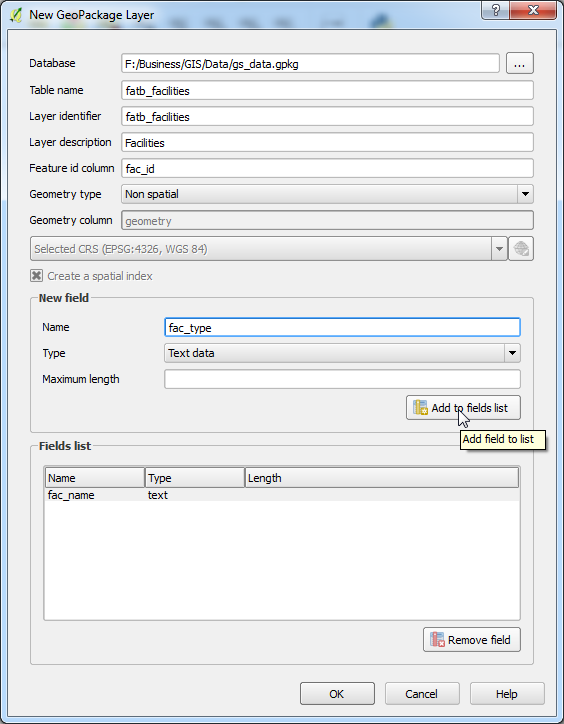
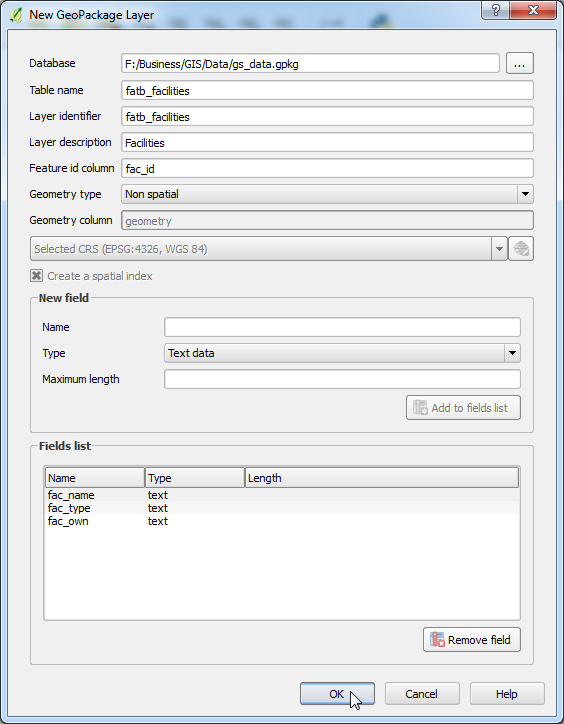
- Basic requirements with a few fields added. Click Ok to create.
There are a myriad of data types that can be added to QGIS. This should cover the major ones you will want to use. The web layers all have additional Esri specific types that can be added. The process is basically the same, just a different URL.
For more information about why you should always have a Unique ID field, see this Tip of the Day: Ensure you have a Unique ID for each table in the database
Leave me a comment with your favorite data type!
Hi,
I wanted (in Qgis) to have a spatial lite database and a layer to display the points on a background map.
I can create the Db but I cannot see the points. The do not get displayed.
What could be preventing the display? Could it be a setup in Qgis?
I am running out of hints. If you have any ideas that would help.
Kid regards,
Caro